Live METAR & TAF map with 3D cloud profiles
METAR & TAF 3D is a live aviation weather map: every reporting airport decoded in plain language, with flight categories, runway crosswind, a 7-day meteogram and a 3D vertical cloud profile per airport.
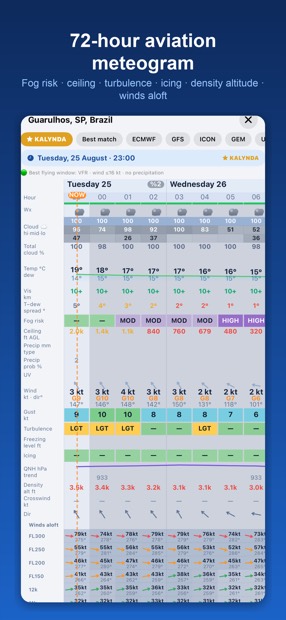
Forecasts come from the Kalynda model — a calibrated blend of ECMWF, GFS, ICON, GEM, Météo-France and UK Met Office, weighted against live observations. Kalynda
What is a METAR?
A METAR (Meteorological Aerodrome Report) is the routine, coded observation of the actual weather at an airport, issued every hour or half-hour in UTC under ICAO Annex 3. One line carries the wind, visibility, present weather, cloud layers, temperature, dew point and altimeter setting: LTBS 081350Z 24012G22KT 9999 FEW030 SCT100 28/17 Q1012 NOSIG reads as Dalaman, day 08 at 13:50 UTC, wind 240° at 12 knots gusting 22, visibility 10 km or more, few cloud at 3,000 ft and scattered at 10,000 ft, 28 °C with a 17 °C dew point, QNH 1012 hPa, no significant change expected. When conditions change sharply between routine reports a SPECI is issued in the same format. Full group-by-group walkthrough: How to read METAR reports.
What is a TAF?
A TAF (Terminal Aerodrome Forecast) is the forecast for the same airport, normally covering 24 or 30 hours and issued four times a day. It uses the same codes as the METAR for wind, visibility, weather and cloud, but adds time windows: FM for a change from a given hour, BECMG for a gradual change, TEMPO for temporary fluctuations and PROB30/PROB40 for lower-probability events. Reading METAR and TAF together is the whole discipline: the observation tells you whether the forecast is coming true. Every airport page on this site shows both, decoded, with the flight category computed for the current report and for each TAF period.
Flight categories at a glance
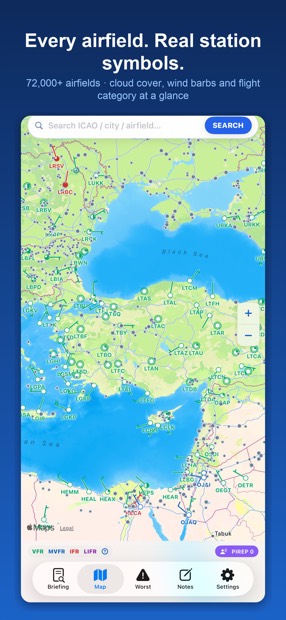
Aviation weather maps colour airports by four categories derived from ceiling and visibility, the worse element governing: VFR (ceiling above 3,000 ft and visibility over 5 SM), MVFR (1,000–3,000 ft or 3–5 SM), IFR (500–999 ft or 1–3 SM) and LIFR (below 500 ft or under 1 SM). The ceiling is the lowest broken or overcast layer, or the vertical visibility — scattered cloud never counts. A category describes the weather, not the rules you fly under; the difference, the thresholds and NATO colour states are covered in VFR vs IFR flight categories explained.
What the map shows
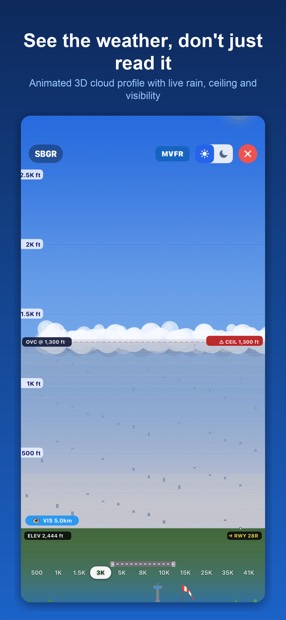
Each station marker carries the live flight category. Clicking it opens the raw METAR with every code explained, the decoded summary, the runway diagram with headwind and crosswind components, a meteogram out to 14 days from the Kalynda multi-model consensus, and a 3D vertical profile of the cloud layers. Forecast accuracy is measured continuously against the observations that follow, so the meteogram comes with a verified error figure for each horizon. Data covers more than 4,000 reporting airports worldwide, refreshed as new observations arrive.
Popular airports
LTFM Istanbul LTFJ Istanbul Sabiha Gökçen LTAC Ankara Esenboğa LTAI Antalya LTBS Dalaman LTFE Bodrum-Milas LTBJ İzmir Adnan Menderes LTCG Trabzon LTAU Kayseri LTAJ Gaziantep EGLL London Heathrow EGKK London Gatwick EGCC Manchester EIDW Dublin LFPG Paris Charles de Gaulle LFPO Paris Orly EHAM Amsterdam Schiphol EBBR Brussels EDDF Frankfurt EDDM Munich EDDB Berlin Brandenburg LSZH Zurich LOWW Vienna LKPR Prague EPWA Warsaw LHBP Budapest LIRF Rome Fiumicino LIMC Milan Malpensa LEMD Madrid Barajas LEBL Barcelona LPPT Lisbon EKCH Copenhagen ESSA Stockholm Arlanda ENGM Oslo Gardermoen EFHK Helsinki LGAV Athens UUEE Moscow Sheremetyevo OMDB Dubai OMAA Abu Dhabi OTHH Doha Hamad OERK Riyadh OEJN Jeddah HECA Cairo KJFK New York JFK KLAX Los Angeles KORD Chicago O'Hare KATL Atlanta CYYZ Toronto Pearson VHHH Hong Kong WSSS Singapore Changi RJTT Tokyo Haneda YSSY Sydney
All airports by country · METAR near me · World weather rankings
Frequently asked questions
How often is a METAR updated? Routine reports are hourly, half-hourly at many large airports, with SPECI reports whenever the weather changes significantly.
What does 9999 mean? Visibility of 10 km or more; US stations report 10SM instead.
What is CAVOK? Visibility 10 km or more, no significant cloud below 5,000 ft or the minimum sector altitude, no cumulonimbus, no significant weather.
Is the METAR time local? No — all times are UTC, shown as day-hour-minute followed by Z.
Where does the forecast come from? From the Kalynda model, a calibrated blend of ECMWF, GFS, ICON, GEM, Météo-France and UK Met Office runs, weighted by their recent skill at each station.
info@metarandtaf.com · Privacy / KVKK · Terms · Refund & Cancellation · Subscription Contract · Preliminary Information · Cookies · Disclaimer

Get the app
The same aviation weather on iPhone, iPad and Android — 3D cloud profile, meteogram and runway wind in your pocket.
Download on the App Store Get it on Google Play